Enabling Healthcare Data Visualization with BI
- Moving from "big data" to "wide data"
- Visualization of data through DataOps and technology
- Data Visualization benefits for the Revenue Cycle Management
In the digital world, we are seeing tremendous growth and robustness of data being collected through various systems, particularly in healthcare. Many people are familiar with the concept of "big data" and, in recent years, have deployed initiatives to understand and mine that data. However, in many cases, the data is fragmented, coming from various sources and different formats leading to the inability to fully harness the power of the data.

According to a recent press release from Gartner:
By 2020, most data and analytics use cases will require connecting to distributed data sources, leading enterprises to double their investments in metadata management.
Facilitating Data Aggregation
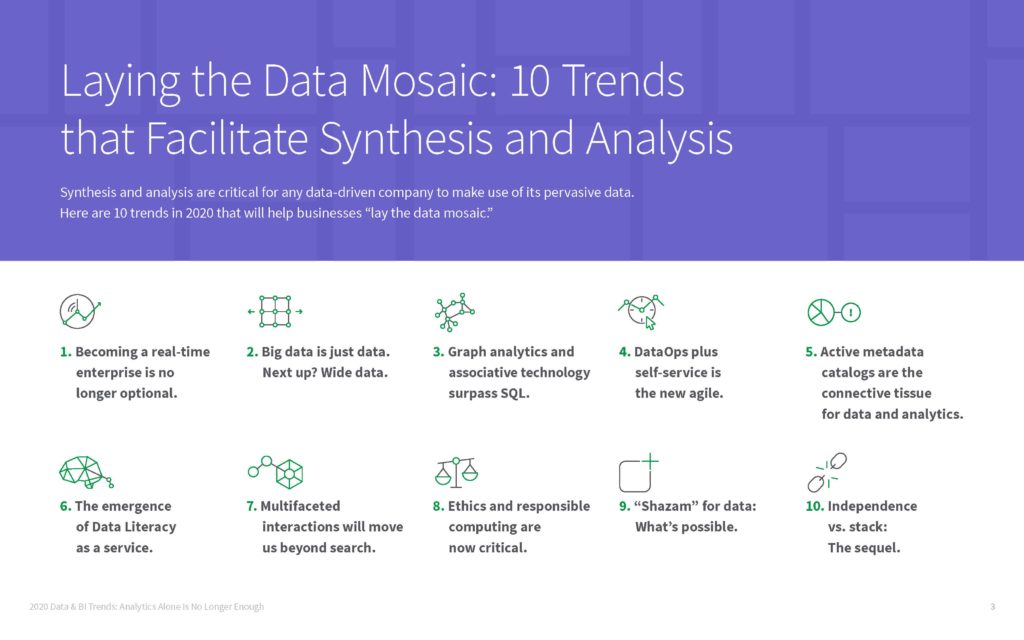
Qlik, a leader in turning data into business value, offers 10 trends to focus on that help sort out the data landscape (download full white paper):

Key takeaways from the white paper:
- Wide Data - focus on the variety of the data, not total amount
- Create a DataOps team to facilitate data integration
- Utilize metadata and technologies to correlate data points
- Empower data literacy to your clients
By taking into account the trends within data, RCM servicers can provide meaningful data analytics and business intelligence for their healthcare clients.
Visualization of Wide Data for Business Intelligence
Research shows that around two-thirds (65%) of people are visual learners. Concepts that are difficult to understand -- or in this case, large amounts of fragmented data -- present a challenge for many to fully grasp.
From a RCM servicers prospective, taking the wide range of data and transforming it into visuals serves as a best approach to illustrate value to healthcare organizations. It is important to deploy technologies and platforms that will aggregate data from electronic remittance advice from payers -- along with data from paper-based remittances/EOBs and correspondence/denial letters -- to provide a full scope of the landscape and provide visual representations of trends for business intelligence.
Visualization from OrboGraph's Healthcare Payments Automation Center (HPAC) and Access Denial Intelligence.